The slowing down of ocean currents could have a devastating effect on our climate
“This has been predicted, basically, for decades that this circulation would weaken in response to global warming. And now we have the strongest evidence that this is already happening,” said Stefan Rahmstorf of Potsdam University who contributed to this research.
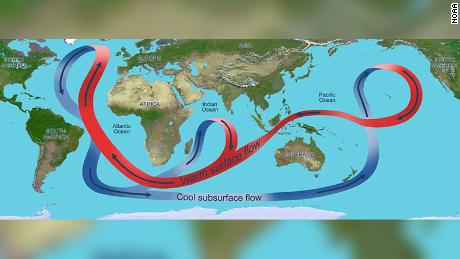
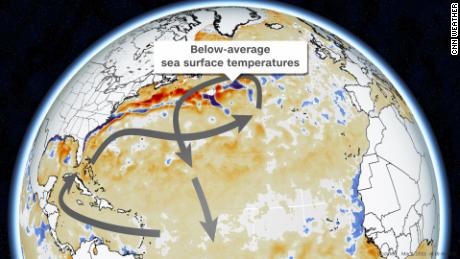
The Atlantic Meridional Overturning Circulation (AMOC) transports water across the planet’s oceans, including the Atlantic, Pacific and Indian. The region contributing to the slowdown is the North Atlantic, according to the research.
“The idea (of this film), which is actually correct, is that if this Atlantic overturning circulation breaks down all together, this will lead to a strong cooling around the northern Atlantic, especially into Europe, into the kind of coastal areas (of) Britain and Scandinavia. But that’s only true if the overturning breaks down all together,” Rahmstorf said.
“This indicates that the slowdown is likely not a natural change but the result of human influence. The AMOC has a profound influence on global climate, and particularly in North America and Europe, so this evidence of an ongoing weakening of the circulation is critical new evidence for the interpretation of future projections of regional and global climate,” said Andrew Meijers, deputy science leader of polar oceans at British Antarctic Survey.
“Both surface warming and the increased water cycle, increased rainfall and the ice melt are all a consequence of global warming” across parts of the North Atlantic Ocean, he said.
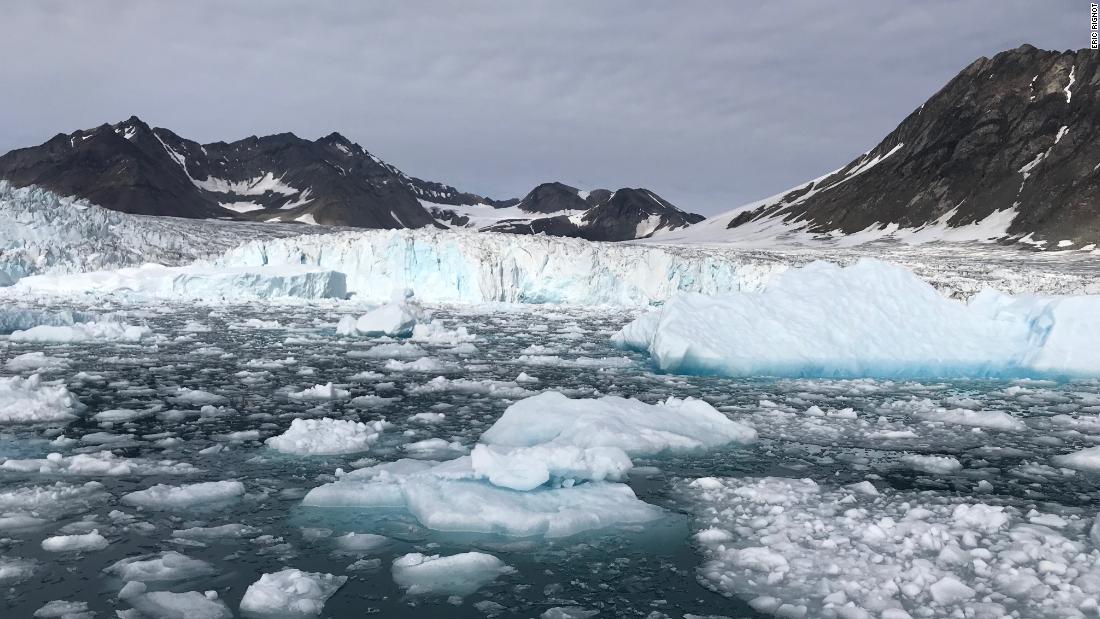
As warm water currents move north, they typically turn back south as it gets cooler and heavier. Added freshwater from the melting ice is causing this turn to be slower because of reduced salinity.
US East Coast to see higher sea levels
One of the main impacts of the slowing ocean circulation is on sea levels, especially those of the US East Coast.
“The northward surface flow of the AMOC leads to a deflection of water masses to the right, away from the US East Coast. This is due to Earth’s rotation that diverts moving objects such as currents to the right in the Northern Hemisphere and to the left in the Southern Hemisphere. As the current slows down, this effect weakens and more water can pile up at the US East Coast, leading to an enhanced sea-level rise,” said Levke Caesar, one of the authors of the report.
The rate at which these waters are rising has also increased in recent years.
“The pace of global sea-level rise more than doubled from 1.4 mm per year throughout most of the twentieth century to 3.6 mm per year from 2006-2015,” said NOAA.
A further slowdown of global ocean circulation, especially along the crucial Gulf Stream current off the eastern coastline of the US, could combine with the already accelerating sea-level rise to make major Northeastern cities even more vulnerable to flooding.
Hotter heat waves, stronger hurricanes
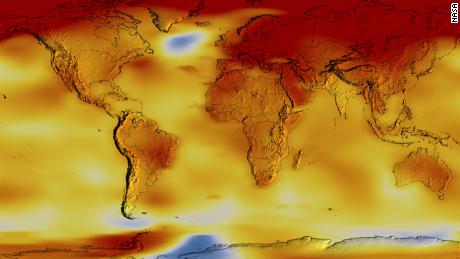
“The world’s seven warmest years have all occurred since 2014, with 10 of the warmest years occurring since 2005,” said NOAA. Heat waves are becoming more frequent already.
The ocean and the currents also play a role in absorbing carbon dioxide, the most dominant greenhouse gas, from the atmosphere. The changing currents could decrease the amount of carbon being taken out of the atmosphere, according to NASA.
[embedded content]
Marine organisms “very strongly depend on these ocean currents, which basically set the conditions for the whole ecosystem in terms of nutrient supply, temperature, and salinity conditions,” Rahmstorf said.
When asked whether the AMOC could slow down further or even stop, Rahmstorf said climate models suggest currents will slow down to between 34% and 45% by 2100.
“Despite a lot of research over the last decade on this, it’s very hard to pin down quantitatively, how far away is this tipping point. But the kind of model simulations that I know suggest that if you weaken this circulation by roughly half, you’re getting into a critical state. And so this could well … happen by the end of the century,” Rahmstorf said.
“We should (strive to) stay well clear of that tipping point because the consequences if the circulation would break down all together would be really dramatic.”
![]()


